Cricket has long celebrated bowlers based on their sheer wicket count, but does that truly reflect greatness? If the Greatest ODI bowler were simply the one with the most wickets, why has the debate persisted for decades?
The need for a more comprehensive analysis arises from several limitations in conventional evaluations. Many legendary bowlers played significantly fewer matches due to their era or team schedules, while others were deprived of favorable conditions that could have boosted their numbers.
Additionally, surface conditions, opposition strength, and the impact of a bowler’s performance in match-defining moments often go overlooked.
Some bowlers thrived in bilateral series but struggled in ICC tournaments, while others mastered neutral conditions but were less effective at home.
This study aims to address these gaps by considering a range of impact-based metrics, ensuring that greatest ODI bowler is measured not just by total wickets but by the context in which they were taken.
As the 2025 ICC Champions Trophy approaches, this analysis provides a more objective and insightful ranking of ODI’s greatest bowlers, sparking discussions that go beyond just raw numbers.
Methodology
To ensure a comprehensive assessment, we included bowlers who have taken a minimum of 195 wickets in ODIs. The ranking is based on various impact metrics, with each factor assigned a specific weightage to calculate an overall rating.
The key attributes considered in this study to determine the Greatest ODI bowler of all-time are:
1. Wicket-Taking Attributes
- Overall Wickets: Total wickets taken in an ODI career. Top 5 are down here:
| Player | Overall Wickets | |
| 1 | Muttiah Muralidaran | 534 |
| 2 | Wasim Akram | 502 |
| 3 | Waqar Younis | 416 |
| 4 | Chaminda Vaas | 400 |
| 5 | Shahid Afridi | 395 |
| 6 | Shaun Pollock | 393 |
| 7 | Glenn McGrath | 381 |
| 8 | Brett Lee | 380 |
| 9 | Lasith Malinga | 338 |
| 10 | Anil Kumble | 337 |
Home Wickets: Wickets taken in home conditions.
| Player | Home Wickets | |
| 1 | Shaun Pollock | 193 |
| 2 | Shakib Al Hasan | 183 |
| 3 | Brett Lee | 169 |
| 4 | Glenn McGrath | 160 |
| 5 | Muttiah Muralidaran | 154 |
| 6 | Mashrafe Mortaza | 147 |
| 7 | Shane Warne | 134 |
| 8 | James Anderson | 131 |
| 9 | Daniel Vettori | 129 |
| 10 | Lasith Malinga | 127 |
Away Wickets: Wickets taken in away matches.
| Player | Away Wickets | |
| 1 | Wasim Akram | 168 |
| 2 | Muttiah Muralidaran | 160 |
| 3 | Chaminda Vaas | 151 |
| 4 | Shahid Afridi | 140 |
| 5 | Brett Lee | 132 |
| 6 | Waqar Younis | 131 |
| 7 | Mitchell Johnson | 114 |
| 8 | Lasith Malinga | 111 |
| 9 | Zaheer Khan | 110 |
| 10 | Glenn McGrath | 108 |
Neutral Wickets: Wickets taken at neutral venues.
| Player | Neutral Venue Wickets | |
| 1 | Wasim Akram | 262 |
| 2 | Muttiah Muralidaran | 220 |
| 3 | Waqar Younis | 218 |
| 4 | Shahid Afridi | 193 |
| 5 | Saqlain Mushtaq | 174 |
Bilateral Wickets: Wickets taken in bilateral series.
| Player | Bilateral Series Wickets | |
| 1 | Shakib Al Hasan | 260 |
| 2 | Shahid Afridi | 232 |
| 3 | Shaun Pollock | 210 |
| 4 | Mashrafe Mortaza | 201 |
| 5 | Daniel Vettori | 185 |
Tournament Wickets: Wickets taken in ICC events and multi-team tournaments.
| Player | Tournament Wickets | |
| 1 | Muttiah Muralidaran | 373 |
| 2 | Wasim Akram | 338 |
| 3 | Glenn McGrath | 302 |
| 4 | Chaminda Vaas | 282 |
| 5 | Waqar Younis | 279 |
Win Wickets: Wickets taken in winning matches (shows how often bowler played a role in his team’s wins).
| Player | Win Wickets | |
| 1 | Muttiah Muralidaran | 368 |
| 2 | Wasim Akram | 326 |
| 3 | Glenn McGrath | 301 |
| 4 | Brett Lee | 297 |
| 5 | Shaun Pollock | 290 |
Loss/Tied/NR Wickets: Wickets taken in Loss/Tied/NR Wickets.
| Player | Loss/Tied/NR Wickets | |
| 1 | Wasim Akram | 176 |
| 2 | Chaminda Vaas | 172 |
| 3 | Muttiah Muralidaran | 166 |
| 4 | Heath Streak | 149 |
| 5 | Anil Kumble | 139 |
2. Impact Calculation
For each of the wicket-taking attributes, we calculated the percentage contribution to a bowler’s total wickets. To determine impact scores, we applied the following weightages:
- Home Impact = Home % × 1 (less weightage due to favorable conditions)
| Player | Home Impact | |
| 1 | Dwayne Bravo | 63.32 |
| 2 | Craig McDermott | 61.58 |
| 3 | Abdur Razzak | 58.94 |
| 4 | Shakib Al Hasan | 57.73 |
| 5 | Trent Boult | 54.98 |
Away Impact = Away % × 1.5 (Away from home, more weightage due to less favorable conditions)
| Player | Away Impact | |
| 1 | Mitchell Johnson | 71.55 |
| 2 | Nuwan Kulasekara | 70.85 |
| 3 | Kyle Mills | 63.75 |
| 4 | Adil Rashid | 62.20 |
| 5 | Rashid Khan | 60.61 |
Neutral Impact = Neutral % × 1.25 (weightage in between home and away)
| Player | Neutral Venue Impact | |
| 1 | Saqlain Mushtaq | 75.52 |
| 2 | Rashid Khan | 74.49 |
| 3 | Waqar Younis | 65.50 |
| 4 | Wasim Akram | 65.24 |
| 5 | Venkatesh Prasad | 61.22 |
Bilateral Impact = Bilateral % × 1 (less weightage easy to make plans for a batter over the course of a bilateral series which makes it easy to pick up wickets)
| Player | Bilateral Impact | |
| 1 | Shakib Al Hasan | 82.02 |
| 2 | Dale Steyn | 78.57 |
| 3 | Dwayne Bravo | 74.88 |
| 4 | Mashrafe Mortaza | 74.44 |
| 5 | Abdur Razzak | 73.91 |
Tournament Impact = Tournament % × 1.5 (More weightage, difficult to take wickets and change plans after every match for different batting orders)
| Player | Tournament Impact | |
| 1 | Glenn McGrath | 118.90 |
| 2 | Craig McDermott | 117.49 |
| 3 | Shane Warne | 111.60 |
| 4 | Venkatesh Prasad | 108.67 |
| 5 | Chaminda Vaas | 105.75 |
Win Impact = Win Wickets % × 1.5 (More weightage as a matter of fact team ended up winning)
| Player | Win Impact | |
| 1 | Ravindra Jadeja | 119.32 |
| 2 | Glenn McGrath | 118.50 |
| 3 | Mitchell Johnson | 117.36 |
| 4 | Brett Lee | 117.24 |
| 5 | Mitchell Starc | 113.73 |
Loss/Tied/NR Impact = Loss/Tied/NR Wickets % × 1
| Player | Loss/Tied/NR Impact | |
| 1 | Heath Streak | 62.34 |
| 2 | Darren Gough | 53.19 |
| 3 | Venkatesh Prasad | 50.00 |
| 4 | Kapil Dev | 49.01 |
| 5 | Kyle Mills | 45.42 |
The sum of these individual impacts gave us the Total Impact score for each bowler.
| Player | Total Impact | |
| 1 | Glenn McGrath | 400.72 |
| 2 | Wasim Akram | 395.92 |
| 3 | Waqar Younis | 395.79 |
| 4 | Muttiah Muralidaran | 394.66 |
| 5 | Shane Warne | 394.45 |
| 6 | Chaminda Vaas | 393.13 |
| 7 | Abdul Razzaq | 392.75 |
| 8 | Allan Donald | 392.46 |
| 9 | Brett Lee | 391.51 |
3. Order Impact
We also evaluated a bowler’s effectiveness based on the batting order of dismissed batsmen. The following weightages were used:
- Top Order (1-3) Impact = Top Order % × 1.5 (Top 3: Nuwan Zoysa 102.78, Chaminda Vaas 90.375, Nuwan Kulasekara 88.95)
- Middle Order (4-7) Impact = Middle Order % × 1.25 (Top 3: Adil Rashid 67.62, Sanath Jayasuriya 65.37, Rashid Khan 65.00)
- Lower Order (8-11) Impact = Lower Order % × 1 (Top 3: Saqlain Mushtaq 31.9, Rashid Khan 28.3, Sanath Jayasuriya 28.2)
- Order Impact Total = Top Order (1-3) Impact + Middle Order (4-7) Impact + Lower Order (8-11) Impact (Top 10: Including only those who has minimum 197 wickets :
| Player | Order Impact | |
| 1 | Nuwan Kulasakera | 137.1 |
| 2 | Chaminda Vaas | 136.2 |
| 3 | Courtney Walsh | 133.7 |
| 4 | Shaun Pollock | 133.6 |
| 5 | Venkatesh Prasad | 133.5 |
| 6 | Heath Streak | 133.3 |
| 7 | Kyle Mills | 133.2 |
| 8 | Makhaya Ntini | 133.1 |
| 9 | Mashrafe Mortaza | 133.0 |
Adding this to the Total Impact score provided the Overall Impact score for each bowler.
Here are the top bowlers according to overall impact.
| Player | Total Impact | Order Impact | Overall Impact | |
| 1 | Glenn McGrath | 400.72 | 131.5 | 532.22 |
| 2 | Chaminda Vaas | 393.13 | 136.2 | 529.33 |
| 3 | Wasim Akram | 395.92 | 130.1 | 526.02 |
| 4 | Waqar Younis | 395.79 | 129.8 | 525.59 |
| 5 | Brett Lee | 391.51 | 131.6 | 523.11 |
| 6 | Abdul Razzaq | 392.75 | 129.9 | 522.65 |
| 7 | Courtney Walsh | 388.44 | 133.7 | 522.14 |
| 8 | Shane Warne | 394.45 | 126.8 | 521.25 |
| 9 | Allan Donald | 392.46 | 127.7 | 520.16 |
| 10 | Muttiah Muralidaran | 394.66 | 125.0 | 519.66 |
| 11 | Craig McDermott | 389.41 | 129.1 | 518.51 |
| 12 | Shoaib Akhtar | 385.53 | 131.7 | 517.23 |
| 13 | Venkatesh Prasad | 382.65 | 133.5 | 516.15 |
| 14 | Mitchell Starc | 387.81 | 128.1 | 515.91 |
| 15 | Nuwan Kulasakera | 378.64 | 137.1 | 515.74 |
| 16 | Zaheer Khan | 378.75 | 130.9 | 515.65 |
| 17 | Curtly Ambrose | 385.33 | 130.2 | 515.53 |
| 18 | Shaun Pollock | 379.45 | 133.6 | 513.05 |
| 19 | Sanath Jayasuriya | 389.55 | 122.8 | 512.35 |
4. Combined Bowling Rate (CBR)
The CBR is a measure that incorporates all three widely accepted bowling metrics in one number ie. bowling average, strike rate, and economy rate using the harmonic mean formula. A lower CBR indicates a more effective bowler. Here are top bowlers according to Combined Bowling Rate calculations for all these bowlers.
| Player | CBR | |
| 1 | Curtly Ambrose | 8.50 |
| 2 | Shaun Pollock | 8.87 |
| 3 | Glenn McGrath | 9.02 |
| 4 | Kapil Dev | 9.13 |
| 5 | Wasim Akram | 9.17 |
| 6 | Muttiah Muralidaran | 9.20 |
| 7 | Rashid Khan | 9.27 |
| 8 | Allan Donald | 9.41 |
| 9 | Craig McDermott | 9.50 |
| 10 | Courtney Walsh | 9.53 |
| 11 | Saqlain Mushtaq | 9.62 |
| 12 | Shane Warne | 9.94 |
| 13 | Chaminda Vaas | 9.97 |
| 14 | Daniel Vettori | 10.14 |
| 15 | Darren Gough | 10.22 |
| 16 | Makhaya Ntini | 10.27 |
| 17 | Waqar Younis | 10.40 |
| 18 | Anil Kumble | 10.41 |
| 19 | Javagal Srinath | 10.44 |
As CBR has an inverse reaction with bowler’s abilities to bowl well, for our final score we needed to divide the total impact for each bowler with CBR value of that bowler.
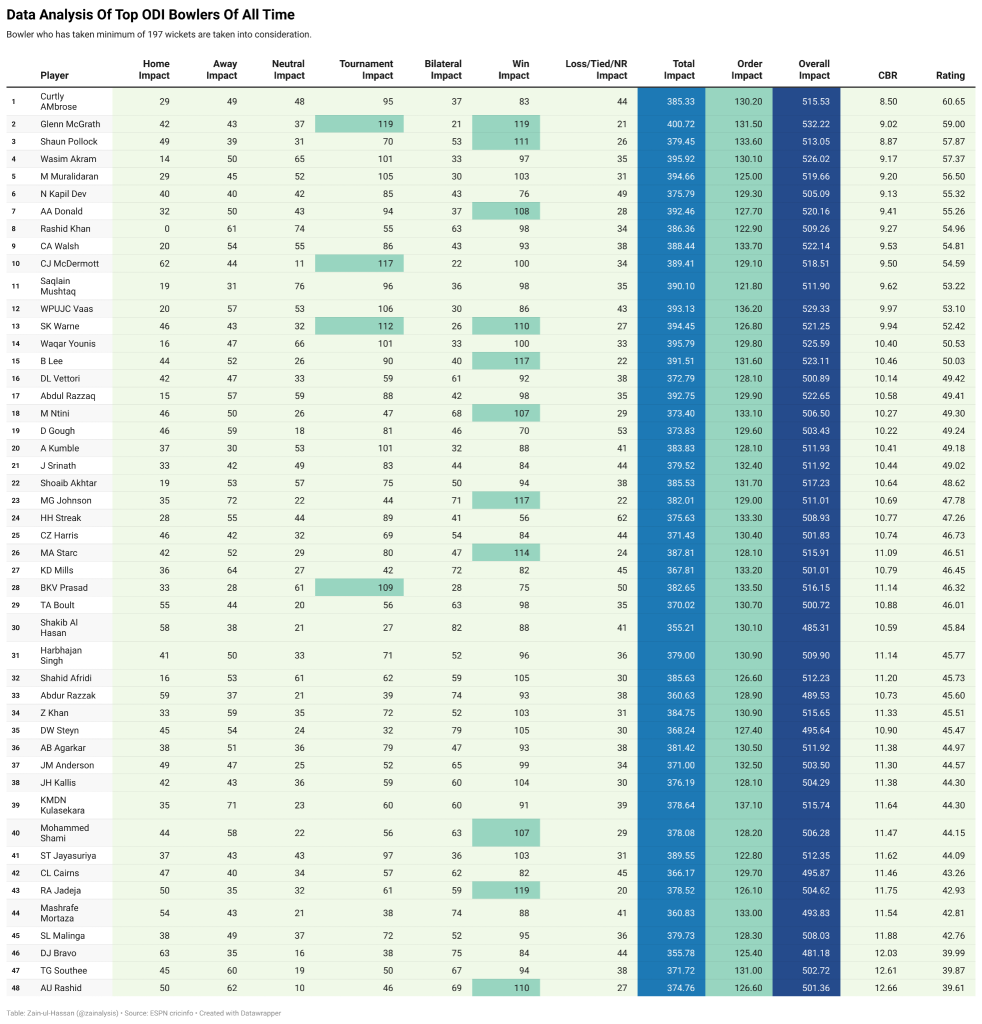
THE GREATEST ODI BOWLER OF ALL-TIME
After computing the final ratings using CBR, the greatest ODI bowler in terms of rankings are as follows:
| Player | Overall Impact | CBR | Rating | |
| 1 | Curtly Ambrose | 515.53 | 8.50 | 60.65 |
| 2 | Glenn McGrath | 532.22 | 9.02 | 59.00 |
| 3 | Shaun Pollock | 513.05 | 8.87 | 57.87 |
| 4 | Wasim Akram | 526.02 | 9.17 | 57.37 |
| 5 | M Muralidaran | 519.66 | 9.20 | 56.50 |
| 6 | N Kapil Dev | 505.09 | 9.13 | 55.32 |
| 7 | AA Donald | 520.16 | 9.41 | 55.26 |
| 8 | Rashid Khan | 509.26 | 9.27 | 54.96 |
| 9 | CA Walsh | 522.14 | 9.53 | 54.81 |
| 10 | CJ McDermott | 518.51 | 9.50 | 54.59 |
| 11 | Saqlain Mushtaq | 511.90 | 9.62 | 53.22 |
| 12 | WPUJC Vaas | 529.33 | 9.97 | 53.10 |
| 13 | SK Warne | 521.25 | 9.94 | 52.42 |
| 14 | Waqar Younis | 525.59 | 10.40 | 50.53 |
| 15 | B Lee | 523.11 | 10.46 | 50.03 |
| 16 | DL Vettori | 500.89 | 10.14 | 49.42 |
| 17 | Abdul Razzaq | 522.65 | 10.58 | 49.41 |
| 18 | M Ntini | 506.50 | 10.27 | 49.30 |
| 19 | D Gough | 503.43 | 10.22 | 49.24 |
| 20 | A Kumble | 511.93 | 10.41 | 49.18 |
| 21 | J Srinath | 511.92 | 10.44 | 49.02 |
| 22 | Shoaib Akhtar | 517.23 | 10.64 | 48.62 |
Conclusion
Our study provides an objective and data-driven ranking of the greatest ODI bowler of all time. By considering various impact metrics, wicket-taking patterns, and situational performances, we have established a comprehensive ranking system. As the Champions Trophy approaches, this analysis serves as a valuable reference for understanding the historical impact of elite bowlers and their contributions to the game in ODI cricket.
While numbers can never fully capture the magic of cricket, this research offers a structured way to appreciate the greatness of some of the best bowlers to ever play ODI cricket. We hope this analysis sparks discussions and debates as we look forward to another thrilling edition of the Champions Trophy.
Author: Zain @zainalysis